Performance indicators are essential tools in managing any IT environment, especially in complex virtualized infrastructures. They provide a crucial starting point for identifying bottlenecks and diagnosing problems. However, knowing which indicators to monitor isn’t the same as understanding them. Interpreting metrics, forming consistent hypotheses, and, above all, trusting the data to guide an investigation require a certain type of confidence.
Recently I experienced not only the importance of knowing what to monitor, but also how to build a logical theory from the metrics.
Scenario: Datastore Performance Degradation
The environment in question consisted of a robust VMware cluster with Dell servers connected to a dedicated Dell storage array via a Fibre Channel network. Until then, performance had been stable — latency metrics were consistently below 1ms, with healthy read and write rates.
That’s when things started to go wrong.
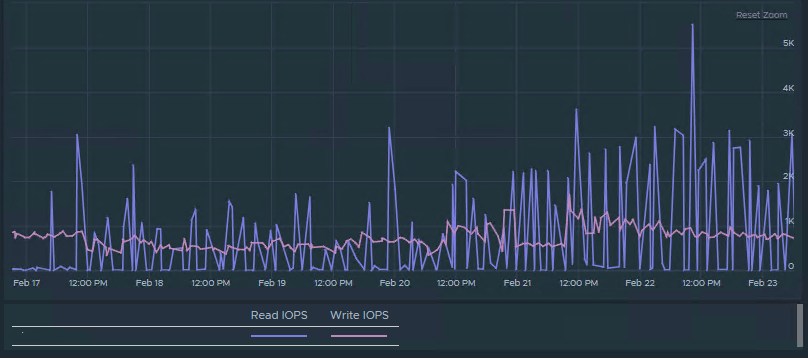
Some datastores began showing serious performance issues. Aria Operations metrics helped identify the problem:
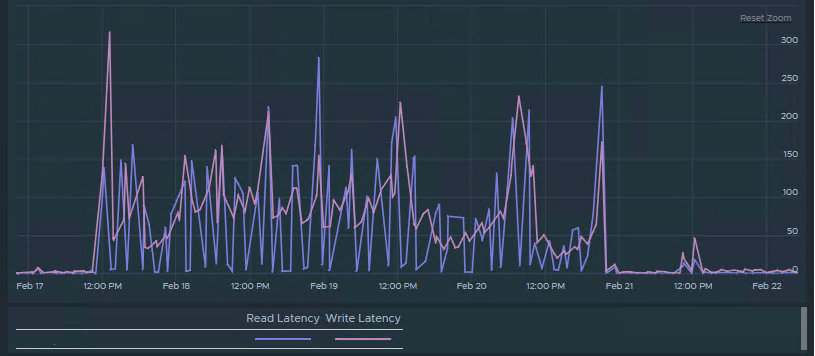
Latency spikes exceeding 100ms, reaching up to 300ms at times.
If you’ve never experienced this, it’s a major issue — VMs start freezing due to slow disk access, essential operations like storage vMotion fail, and sometimes even rebooting a VM becomes impossible.
Diagnostic
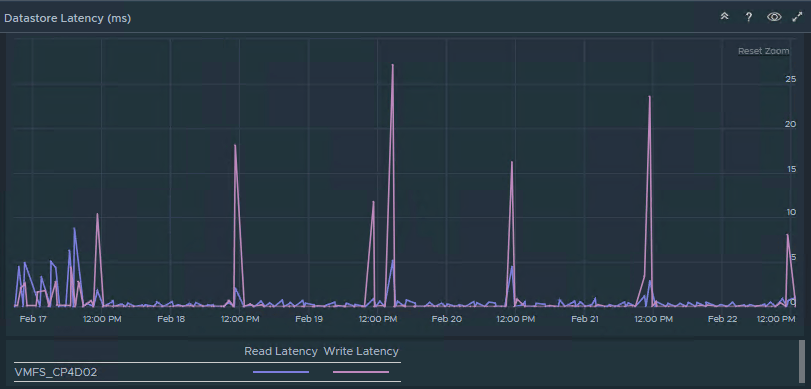
Interestingly, other datastores on the same storage array continued to operate normally, with high IOPS and low latency (generally under 5ms), even while the affected datastores were struggling.
This stark disparity within the same system complicated diagnosis.
Aria Ops showed the truth:

Understanding the metrics
Although I suspected the problem was outside the VMware layer, I continued my investigation.
What helped me troubleshoot the issue was using the esxtop tool (KB 344099). Based on this article, two metrics were critical to my analysis: DAVG/cmd and KAVG/cmd.
| DAVG/cmd (Device Average Latency) | Represent the average time a storage I/O command takes to be processed by the storage device. High values suggest that the storage array itself is slow to respond. |
| KAVG/cmd (Kernel Average Latency) | Represent the average time a command spends in the ESXi kernel. High values here can indicate an issue inside the host or VMkernel (e.g., internal queuing or hypervisor inefficiencies). |
During monitoring, I observed high DAVG/cmd values while KAVG/cmd remained low, which pointed clearly to a storage device issue rather than a VMware host or VMkernel problem.
Root Cause
With the storage vendor’s support, detailed log and diagnostic analysis revealed the root cause: one of the Fibre Channel storage controllers was intermittently failing. In some storage arrays, LUNs (Logical Unit Numbers) can be assigned to specific controllers for load balancing and redundancy. In this case, the datastores attached to controller A were experiencing high latency, while the datastores attached to controller B were still performing well.
This explained why only certain datastores showed performance degradation, while others did not.
Conclusion
This real-world case shows how performance problems are often wrongly attributed to the virtualization layer. It highlights how important it is to know the right tools and which metrics to look at. Beyond that, it’s essential to recognize when the facts point us in a different direction.
In a nutshell, the lessons are:
- Knowing which tools and metrics to monitor
- Correctly interpreting metric evidence
- Being prepared to investigate outside the VMware layer when necessary
Above all, trusting your data and understanding how to interpret it correctly are the keys to identifying the true cause of performance issues.

Leave a comment